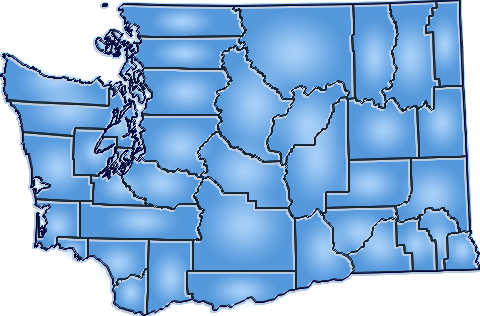
  Introduction & SummaryPair and compare two distinct employment industry sectors of your choosing to examine their relative importance and performance across all of Washington's 39 county economies over 1969-2022. Contrast and assess, for example, the comparative importance of employment for the Construction sector across the counties of Washington against Administrative and Waste Services, or any other two sectors you elect to select. Apply the interactive tools included in this module to conduct your own research about how any two industry sectors compare and contrast across the counties of Washington. The analytical tools at your disposal for ranking and sorting the importance and growth of individual industry sectors across counties include: percent of total local employment, location quotients, percent of State total sector employment, growth rates and growth rates differenced against overall averages locally and their counterparts nationwide. The employment estimates compiled by the Bureau of Economic Analysis (BEA) measure the number of full- and part-time employees, plus the number of proprietors of unincorporated businesses. People holding more than one job are counted in the employment estimates for each job they hold. This means BEA employment estimates represent a job count, not a number-of-people employed count. Also, BEA employment estimates are by place-of-work, rather than by place-of-residence. Directions
Additional Notes on EmploymentThe employment estimates compiled by the Bureau of Economic Analysis (BEA) measure the number of full- and part-time employees, plus the number of proprietors of unincorporated businesses. People holding more than one job are counted in the employment estimates for each job they hold. This means BEA employment estimates represent a job count, not a number-of-people employed count. Also, BEA employment estimates are by place-of-work, rather than by place-of-residence. Additional Suggested AnalysisTo view and examine the short vs. long term growth of all 39 Washington counties click on the graph below.  | Analysis Options Menu |


